Icinga/Nagios check for Sophos antivirus signature freshness
I’ve been running Amavisd-new with scanner components like ClamAV and SpamAssassin on the mail relay for my personal mail for several years. Lately I’ve been thinking that since Amavis supports multiple content scanners I should add another antivirus product. Unfortunately there’s a limited number of free (for home/individual use) antivirus products running on Linux, and quite a few of them are not being maintained, but I found a very promising candidate from Sophos.
Adding Sophos antivirus for Linux to Amavisd-new wasn’t all that difficult (and is covered by other articles elsewhere), but one thing was missing to complete the picture: An automated method for checking whether Sophos is running with updated antivirus signature files. I was hoping to find or write something that could be used with Icinga (or Nagios).
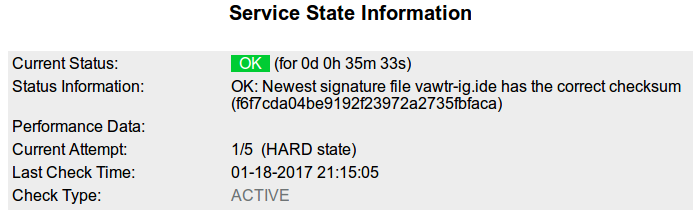
Conveniently, Sophos provides an XML URL containing the file name and md5sum of the latest signature file. Below is the status file at the time of writing:
<?xml version="1.0" encoding="utf-8"?>
<latest><ide>
<name>vawtr-ig.ide</name>
<md5>f6f7cda04be9192f23972a2735fbfaca</md5>
<size>21584</size>
<timestamp>2017-01-18T14:11:00</timestamp>
<published>2017-01-18T17:11:27</published>
</ide></latest>
Having found the status file, writing a short script didn’t take long. I’m using xmlstarlet for better readability. The script is stored as /usr/local/bin/check_sophos.
#!/bin/bash

SOPHOSDIR=/opt/sophos-av/lib/sav

/usr/bin/GET https://downloads.sophos.com/downloads/info/latest_IDE.xml | \
/usr/bin/xmlstarlet fo | \
/usr/bin/awk -F \(\<\|\>\) '{print $2" "$3}' | \
while read attribute value; do
  if [ "$attribute" = "name" ]; then
    FILE="$value"
  elif [ "$attribute" = "md5" ]; then
    MD5SUM="$value"
  fi
  if [ "x$FILE" != "x" -a "y$MD5SUM" != "y" ]; then
    if [ ! -e "${SOPHOSDIR}/${FILE}" ]; then
      echo "WARNING: Sophos has not yet downloaded its latest signature file."
      exit 1
    fi
    CHECKSUM=$(/usr/bin/md5sum "${SOPHOSDIR}/${FILE}" | /usr/bin/awk '{ print $1 }')
    if [ "$CHECKSUM" = "$MD5SUM" ]; then
      echo "OK: Newest signature file ${FILE} has the correct checksum ($MD5SUM)"
      exit 0
    else
      echo "WARNING: ${FILE} seems to be outdated."
      exit 1
    fi
    # Cleanup
    FILE=""; MD5SUM="";
  fi
done
As those fluent in shell scripting will easily see, the script reads the XML status URL and extracts the file name and md5sum of the most recent antivirus signature file. Then the script checks for the file’s existence, and triggers a warning if the file isn’t there. If the file is present, its md5sum is compared to what should be expected from the XML status URL.
After testing the script I added it to Icinga via NRPE, so now I’ll be getting a notice if something’s wrong with Sophos’ antivirus update.